
Oil producing nations, such as Trinidad and Tobago, have experienced economic challenges as the price of oil have reached record lows (falling as low as US$26 per barrel in February). Dramatic falls in oil prices has a severe impact on oil producers, particularly those that rely heavily on the energy sector for revenue. For example, a fall in export revenue (falls due to the fall in export prices) may cause a fiscal deficit, which places an immediate need to cut government expenditure or raise taxes. Consequently, the citizens of such economies are impacted either directly by lower disposable income or indirectly as governments cut expenditure in areas such as education and healthcare.
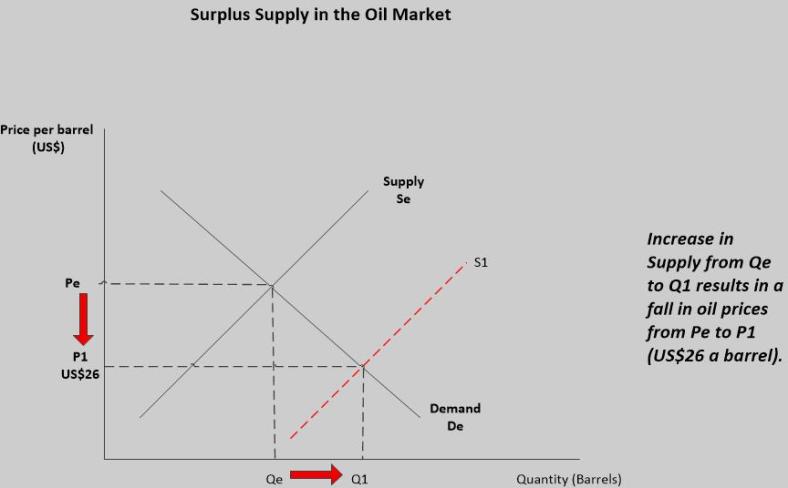
Given the widespread impact of a fall in oil prices, it is reasonable to ask why oil prices have been dropping. The answer to this question lies in a basic economic concept: Demand and Supply Analysis. The decline in oil prices has been the result of surplus oil supply (more oil produced than demanded).
However, in recent weeks the Organisation of Petroleum Exporting Countries (OPEC) has been able to secure deals to cut oil production of both OPEC and non-OPEC members. Following every positive announcement with regards to oil production cuts, there was a rise in oil prices.
Impact of Supply Agreements on Oil Prices
OPEC countries had agreed to cut oil production following a November 30 meeting in Vienna, Austria. OPEC members, such as Saudi Arabia and Iraq, pledged to reduce output by 1.2 million barrels a day. Bloomberg statistics indicated that on November 30, West Texas Intermediate crude futures surged 9.3 percent to US$49.44 a barrel as of 4 p.m. in New York, which marked the biggest one-day gain since February 12.
The November 30 deal hinged on the corporation of non-OPEC oil producers, particularly Russia. Trinidad and Tobago was among 14 non-OPEC countries (which included Russia, Mexico, Bahrain, Colombia, Congo, Egypt, Bolivia, Kazakhstan, Uzbekistan, Turkmenistan, Azerbaijan, Oman and Brunei) that OPEC invited to discuss production cuts in talks held on December 10, in Vienna. These 14 nations account for about 18.8 million barrels a day (approximately 20 percent of global supply) last year.
The meeting of a total of 24 OPEC and non-OPEC countries ended with an agreement to cut oil production. Russia confirmed its commitment to cut 300,000 barrels a day, while other non-OPEC countries agreed to another 258,000 barrels in cuts. Bloomberg statistics indicated that on December 12, West Texas Intermediate crude gained 4.2 percent to $US53.66 a barrel as of 9:33 a.m. New York time, while Brent added 3.8 percent to US$56.42. Both are headed for their highest settlement prices since July last year.
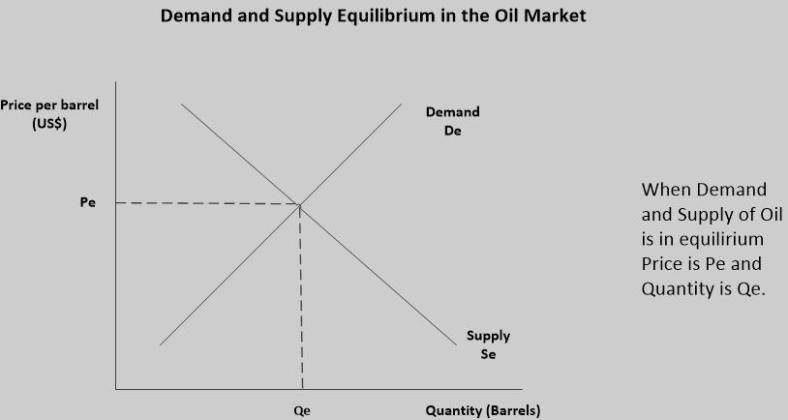
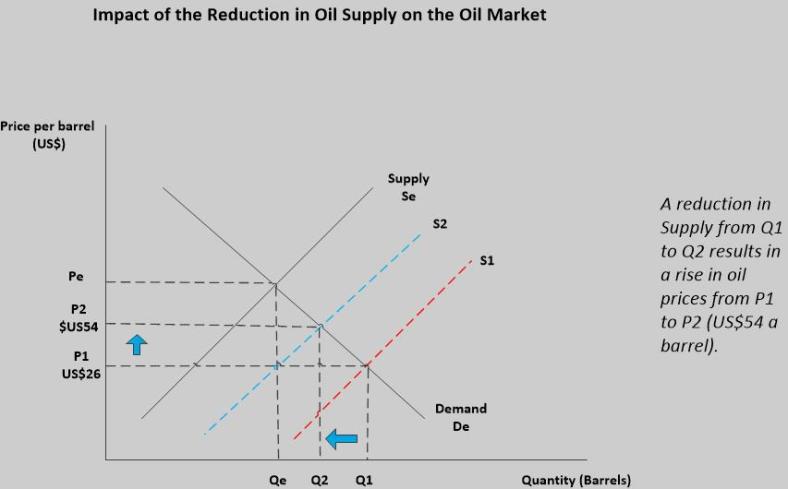
Illustration of Demand and Supply Analysis
Consequently, the rise and fall in oil prices provides a perfect illustration of demand and supply analysis at work in the real world. The diagrams below are an illustration of the reason for oil price movements:
Conclusion
The deal reached on December 10, signifies the first global petroleum cuts in 15 years and covers about 60 percent of the world’s output. However, in the past some OPEC and non-OPEC members have not executed agreed upon supply cuts. The implementation of output cuts by members and non-members provides a major risk to oil prices.
Movements in the financial markets reflect market expectations on what is anticipated to happen with prices. As such, it is likely that any indication that a major oil producer pulls out of the agreement (by increasing supply instead of decreasing) the oil prices will again fall.
Further, the oil market is also at risk of United States (US) shale producers, who have continued to increase output, drillers have been putting more rigs back to work every week. As such, US production can dampen the price acceleration, as they add more output into the market.
By
Jade De Labastide (MSc., BSc.)
JDL Business
